Electrify Chicago
According to the
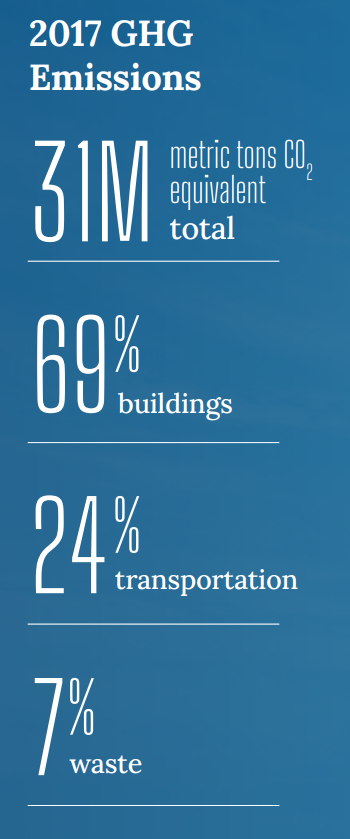
2022 Chicago Climate Action Plan ,
a whopping 69% of Chicago's emissions come from buildings, making it
our biggest challenge and our biggest opportunity as a city to tackle
change. At Electrify Chicago we want to showcase some of the best and worst performing
buildings in the city using publicly available data and manual annotations to add
building photographs and label multi-building owners like universities.
,
a whopping 69% of Chicago's emissions come from buildings, making it
our biggest challenge and our biggest opportunity as a city to tackle
change. At Electrify Chicago we want to showcase some of the best and worst performing
buildings in the city using publicly available data and manual annotations to add
building photographs and label multi-building owners like universities.
You can start by looking at Chicago's buildings with the highest greenhouse gas intensity - this means that they use the most energy when adjusted per unit of square foot, so big buildings could actually perform much better than very inefficient small buildings on this metric.
Chicago Buildings by Greenhouse Gas Intensity
Note: Data only includes large Chicago buildings from 2020
Note: This data only includes buildings whose emissions are reported
under the
Chicago Energy Benchmarking Ordinance. According to the City “As of 2016,
this list includes all commercial, institutional, and residential buildings larger than
50,000 square feet.” This dataset is also then filtered to only buildings with
reported emissions > 1,000 metric tons CO2 equivalent.
This data is also from 2020, but when new benchmark data is available, we'll update the site.
| Property Name / address | Primary Property Type |
Greenhouse Gas Intensity (kg CO2 eq./sqft) |
Total Greenhouse Emissions (metric tons CO2 eq.) |
|---|---|---|---|
|
8527-Ukrainian Village
🚩
2021 W Chicago Ave
| Supermarket/Grocery Store | 27.3 kg/sqft #46 Highest
| 1,502 tons
Lowest 29%
|
|
Jewel Osco, 03224-Irving Park & Narraganset
🚩
6430 W Irving Park Rd
| Supermarket/Grocery Store | 27.2 kg/sqft #48 Highest
| 1,566 tons
Lowest 33%
|
|
303 E Superior Street
🚩
(Northwestern)
303 E Superior Street
| Laboratory | 27.2 kg/sqft #48 Highest
| 11,381 tons
Highest 5%
|
|
70800552 -- Chicago
🚩
7030 S Ashland Ave
| Supermarket/Grocery Store | 27.0 kg/sqft #49 Highest
| 1,712 tons
Lowest 38%
|
|
Jewel Osco, 03349-Narragansett & Diversey
2520 N Narragansett Ave
| Supermarket/Grocery Store | 26.9 kg/sqft
Highest 4%
| 1,728 tons
Lowest 39%
|
|
Jewel Osco, 02502-Clybourn & Wrightwood
2550 N Clybourn St
| Supermarket/Grocery Store | 26.9 kg/sqft
Highest 4%
| 2,293 tons
Highest 43%
|
|
5841 S. Maryland Ave MC0985
🚨
(UChicago)
5841 S. Maryland Ave MC0985
| Hospital (General Medical & Surgical) | 26.9 kg/sqft
Highest 4%
| 146,536 tons #2 Highest
|
|
Lurie Children's Lincoln Park Outpatient Center - Deming
467 W Deming Pl
| Mixed Use Property | 26.9 kg/sqft
Highest 4%
| 1,692 tons
Lowest 38%
|
|
Market Place at Six Corners 10361
4612 - 4730 W Irving Park Rd
| Other - Mall | 26.8 kg/sqft
Highest 4%
| 2,090 tons
Highest 49%
|
|
Rush University Medical Center
🚨
1653 W Congress Pkwy
| Hospital (General Medical & Surgical) | 26.4 kg/sqft
Highest 4%
| 102,661 tons #3 Highest
|
|
70800789 -- 47th ~ Damen
4620 S Damen Ave
| Supermarket/Grocery Store | 26.2 kg/sqft
Highest 4%
| 1,999 tons
Lowest 48%
|
|
Gateway to West Loop
16 - 40 S Halsted St
| Supermarket/Grocery Store | 26.1 kg/sqft
Highest 4%
| 2,500 tons
Highest 38%
|
|
8516-Bucktown
2112 N ASHLAND AVE
| Supermarket/Grocery Store | 26.1 kg/sqft
Highest 4%
| 2,092 tons
Highest 49%
|
|
CME Group Inc
333 S LaSalle St
| Financial Office | 26.0 kg/sqft
Highest 4%
| 6,781 tons
Highest 10%
|
|
300 E Superior Street
(Northwestern)
300 E Superior Street
| Laboratory | 26.0 kg/sqft
Highest 4%
| 7,911 tons
Highest 8%
|
Data Source:
Chicago Energy Benchmarking Data